Observability · Arbisoft
Claude Code telemetry pipeline
Team scoped Claude Code telemetry flowing into DevLake. An authenticated OpenTelemetry Collector with trusted attribution, Prometheus for live metrics and a durable MySQL path for analytics.
Key decisions
- Stamp team attribution in the Collector from the authenticated credential, never from anything the client sends.
- Measured real traffic on staging before choosing storage. About 32 MB a day for 33 developers made raw data in MySQL practical.
- Kept Prometheus for live views and made MySQL the replayable record, fed through a persistent queue.
- Modelled project attribution as a relation instead of a metric label, so data shared across projects is never double counted.
- Role
- Designed and built the pipeline end to end: credentials and UI in DevLake, Collector and Prometheus config, the MySQL ingest and conversion path, Grafana dashboards and the staging rollout.
- When
- Jul to Sep 2026
- Links
- Stack
- OpenTelemetry Collector, Prometheus, Grafana, Go, MySQL, React, Docker, Playwright
Claude Code sends OTLP metrics with a team scoped Basic Auth credential to an OpenTelemetry Collector. The Collector checks the credential, strips client supplied attribution and stamps the trusted team. It then splits into two paths. The durable path queues batches on disk and forwards them over OTLP/HTTP to DevLake, which commits raw batches to MySQL. A leased converter turns them into hourly and daily facts that Grafana reads. The live path converts delta sums to cumulative and exposes them to Prometheus, which scrapes every 15 seconds for live Grafana panels.
Claude Code can export usage over OpenTelemetry: sessions, tokens, cost, lines changed, commits and pull requests. The product wanted that next to the GitHub and Jira data DevLake already collects, per team and per project, so questions about AI usage and delivery have somewhere to live.
The problem
Claude Code pushes OTLP to whatever endpoint an admin puts in managed settings. That means an internet facing collector, credentials sitting in a config file on developer machines and attribution you can't trust if the client is allowed to set it.
The pipeline went through two shapes. It started as Collector to Prometheus to Grafana, which is great for live metrics. It later grew a durable path into MySQL once the product needed per project daily numbers that join with the rest of DevLake's data. The Prometheus side stayed.
Cardinality was the first real problem. Claude Code puts a session ID on every metric point, and every run gets a new one, so each session created a new Prometheus series. Managed settings turn session IDs off, which keeps Prometheus healthy but means two concurrent sessions for the same person are indistinguishable downstream. So the contract is explicit: team and account rollups are supported, per session forensics from metrics alone are not.
Credentials and trusted attribution
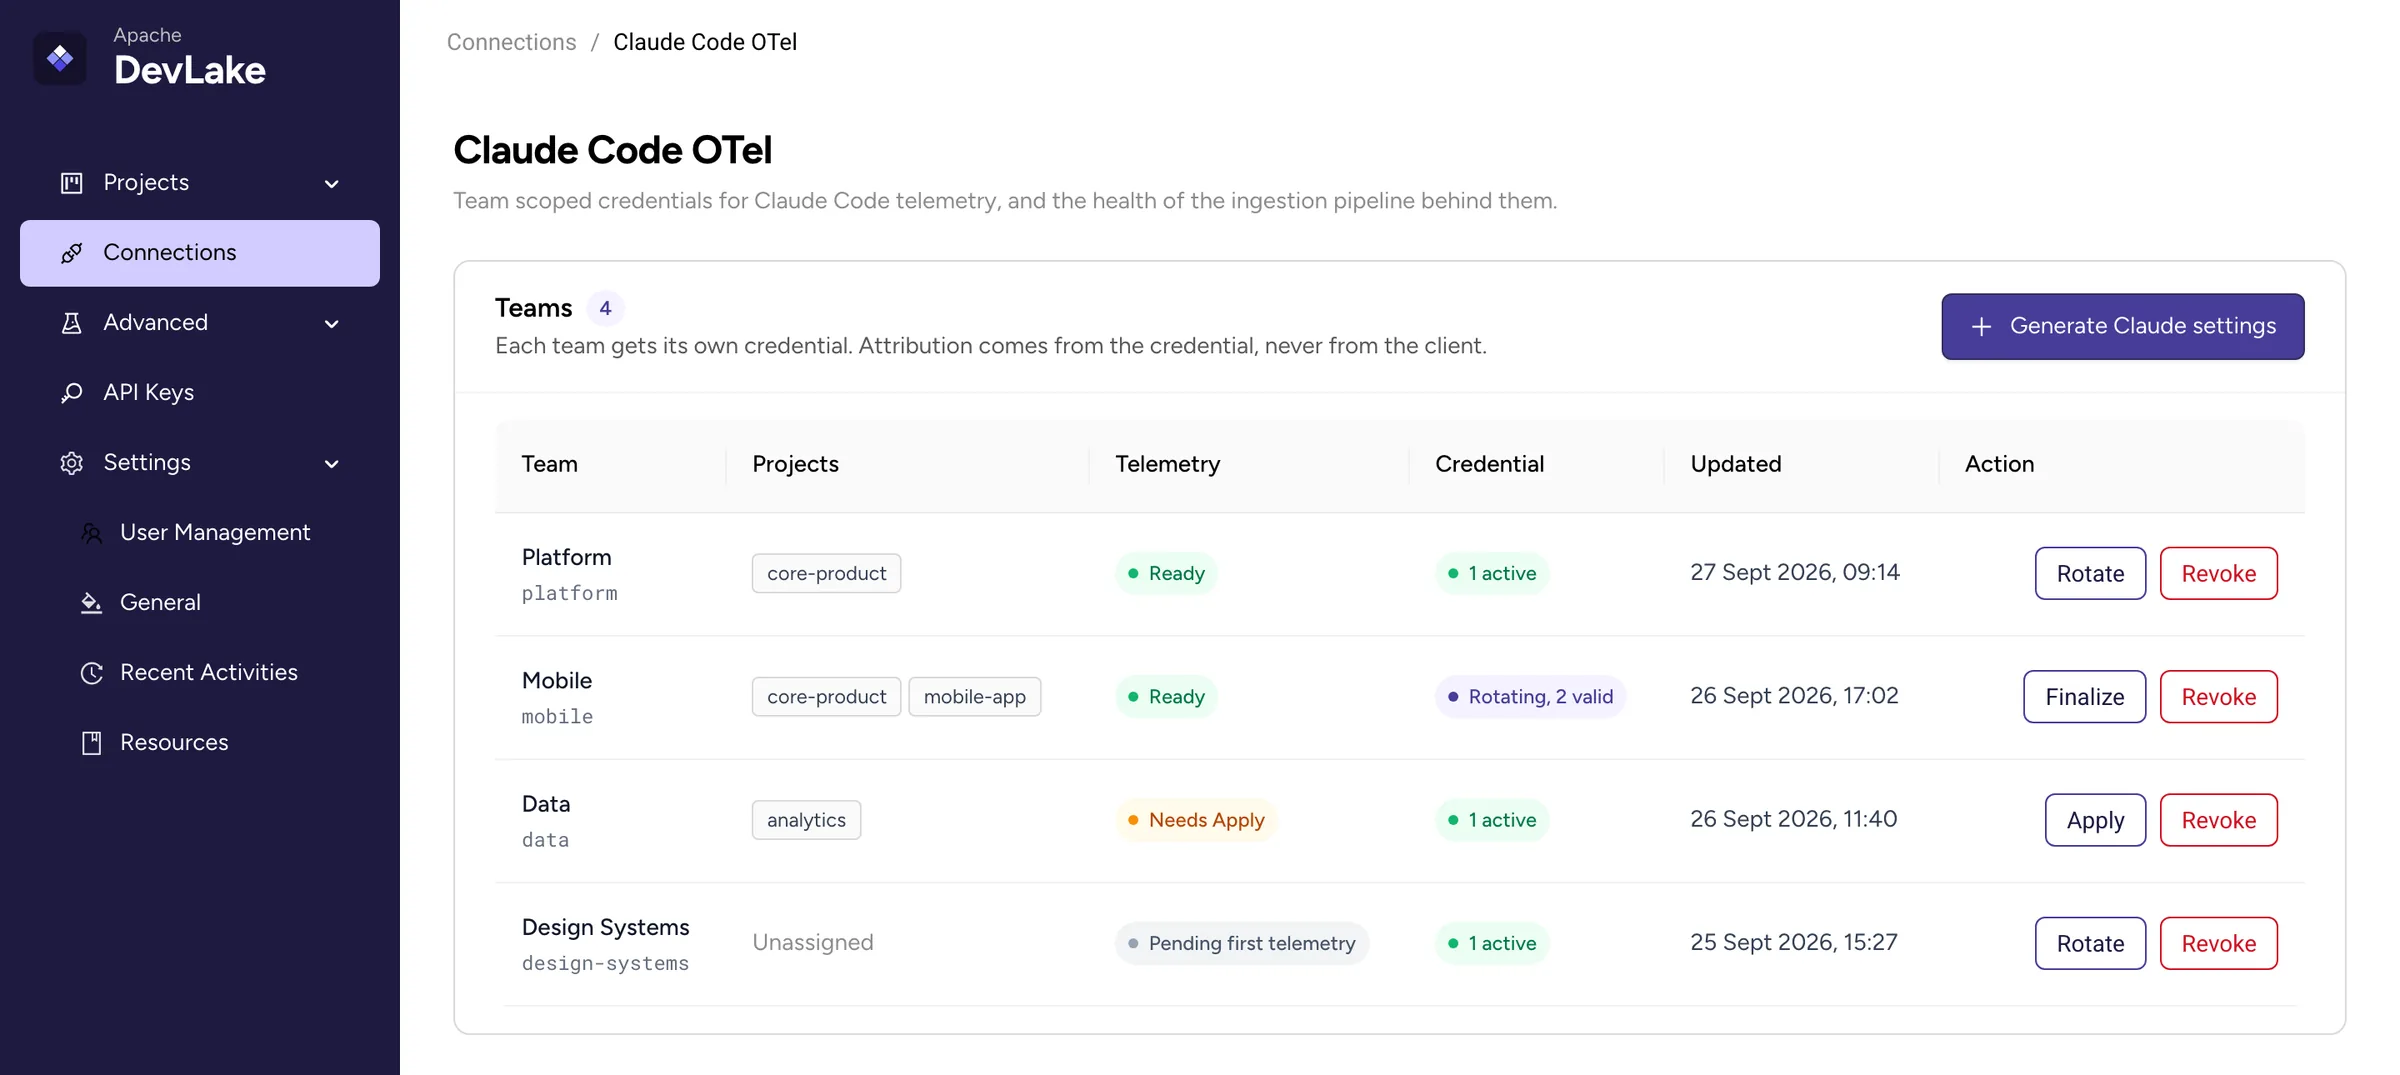
DevLake mints one credential per team: a high entropy username that embeds an immutable team slug, plus a password. It writes only the hash to an htpasswd file on a volume shared with the Collector, shows the complete Claude Code settings once and never stores the plaintext or the encoded header.
The Collector checks Basic Auth, strips any devlake_team or devlake_project attributes the client sent and then stamps devlake_team from the authenticated username. A client can't claim to be another team, even with a valid credential.
Rotation without downtime
Rotation adds a second credential while the old one keeps working. Admins update managed settings, then finalize to drop the old one. The auth file is rebuilt from every active and retiring credential, so changing one team can never remove another team's verifier.
The pinned Collector doesn't hot reload htpasswd, so DevLake asks a small restart helper to bounce it. The helper holds the Docker socket and DevLake doesn't. It only accepts an authenticated request to restart the configured Collector and never takes a container name or command from the caller. If the restart isn't confirmed the connection is marked as needing Apply instead of pretending it worked.
A team credential is created and becomes active. Rotating creates a second credential while the first moves to retiring and still works. After the admin updates Claude Code managed settings, finalizing removes the old credential. Each change rewrites the auth file and restarts the Collector through the restart helper.
A durable path into MySQL
Prometheus is a good time series store but an awkward source of truth for daily per project analytics that join with pull requests and issues. My first plan avoided building anything new: keep Prometheus as a short retention buffer and sync windowed counter increases into hourly MySQL rows. It was cheaper, but it made Prometheus the only raw record.
Before choosing, I added a bounded file exporter on staging purely to measure the real payload shape and volume. It came out around 32 MB a day for 33 active developers. That was small enough to keep the raw data in DevLake itself, which made it queryable without shell access to a VM, replayable and convertible into DevLake's usual raw, tool and domain layers. So that's what shipped.
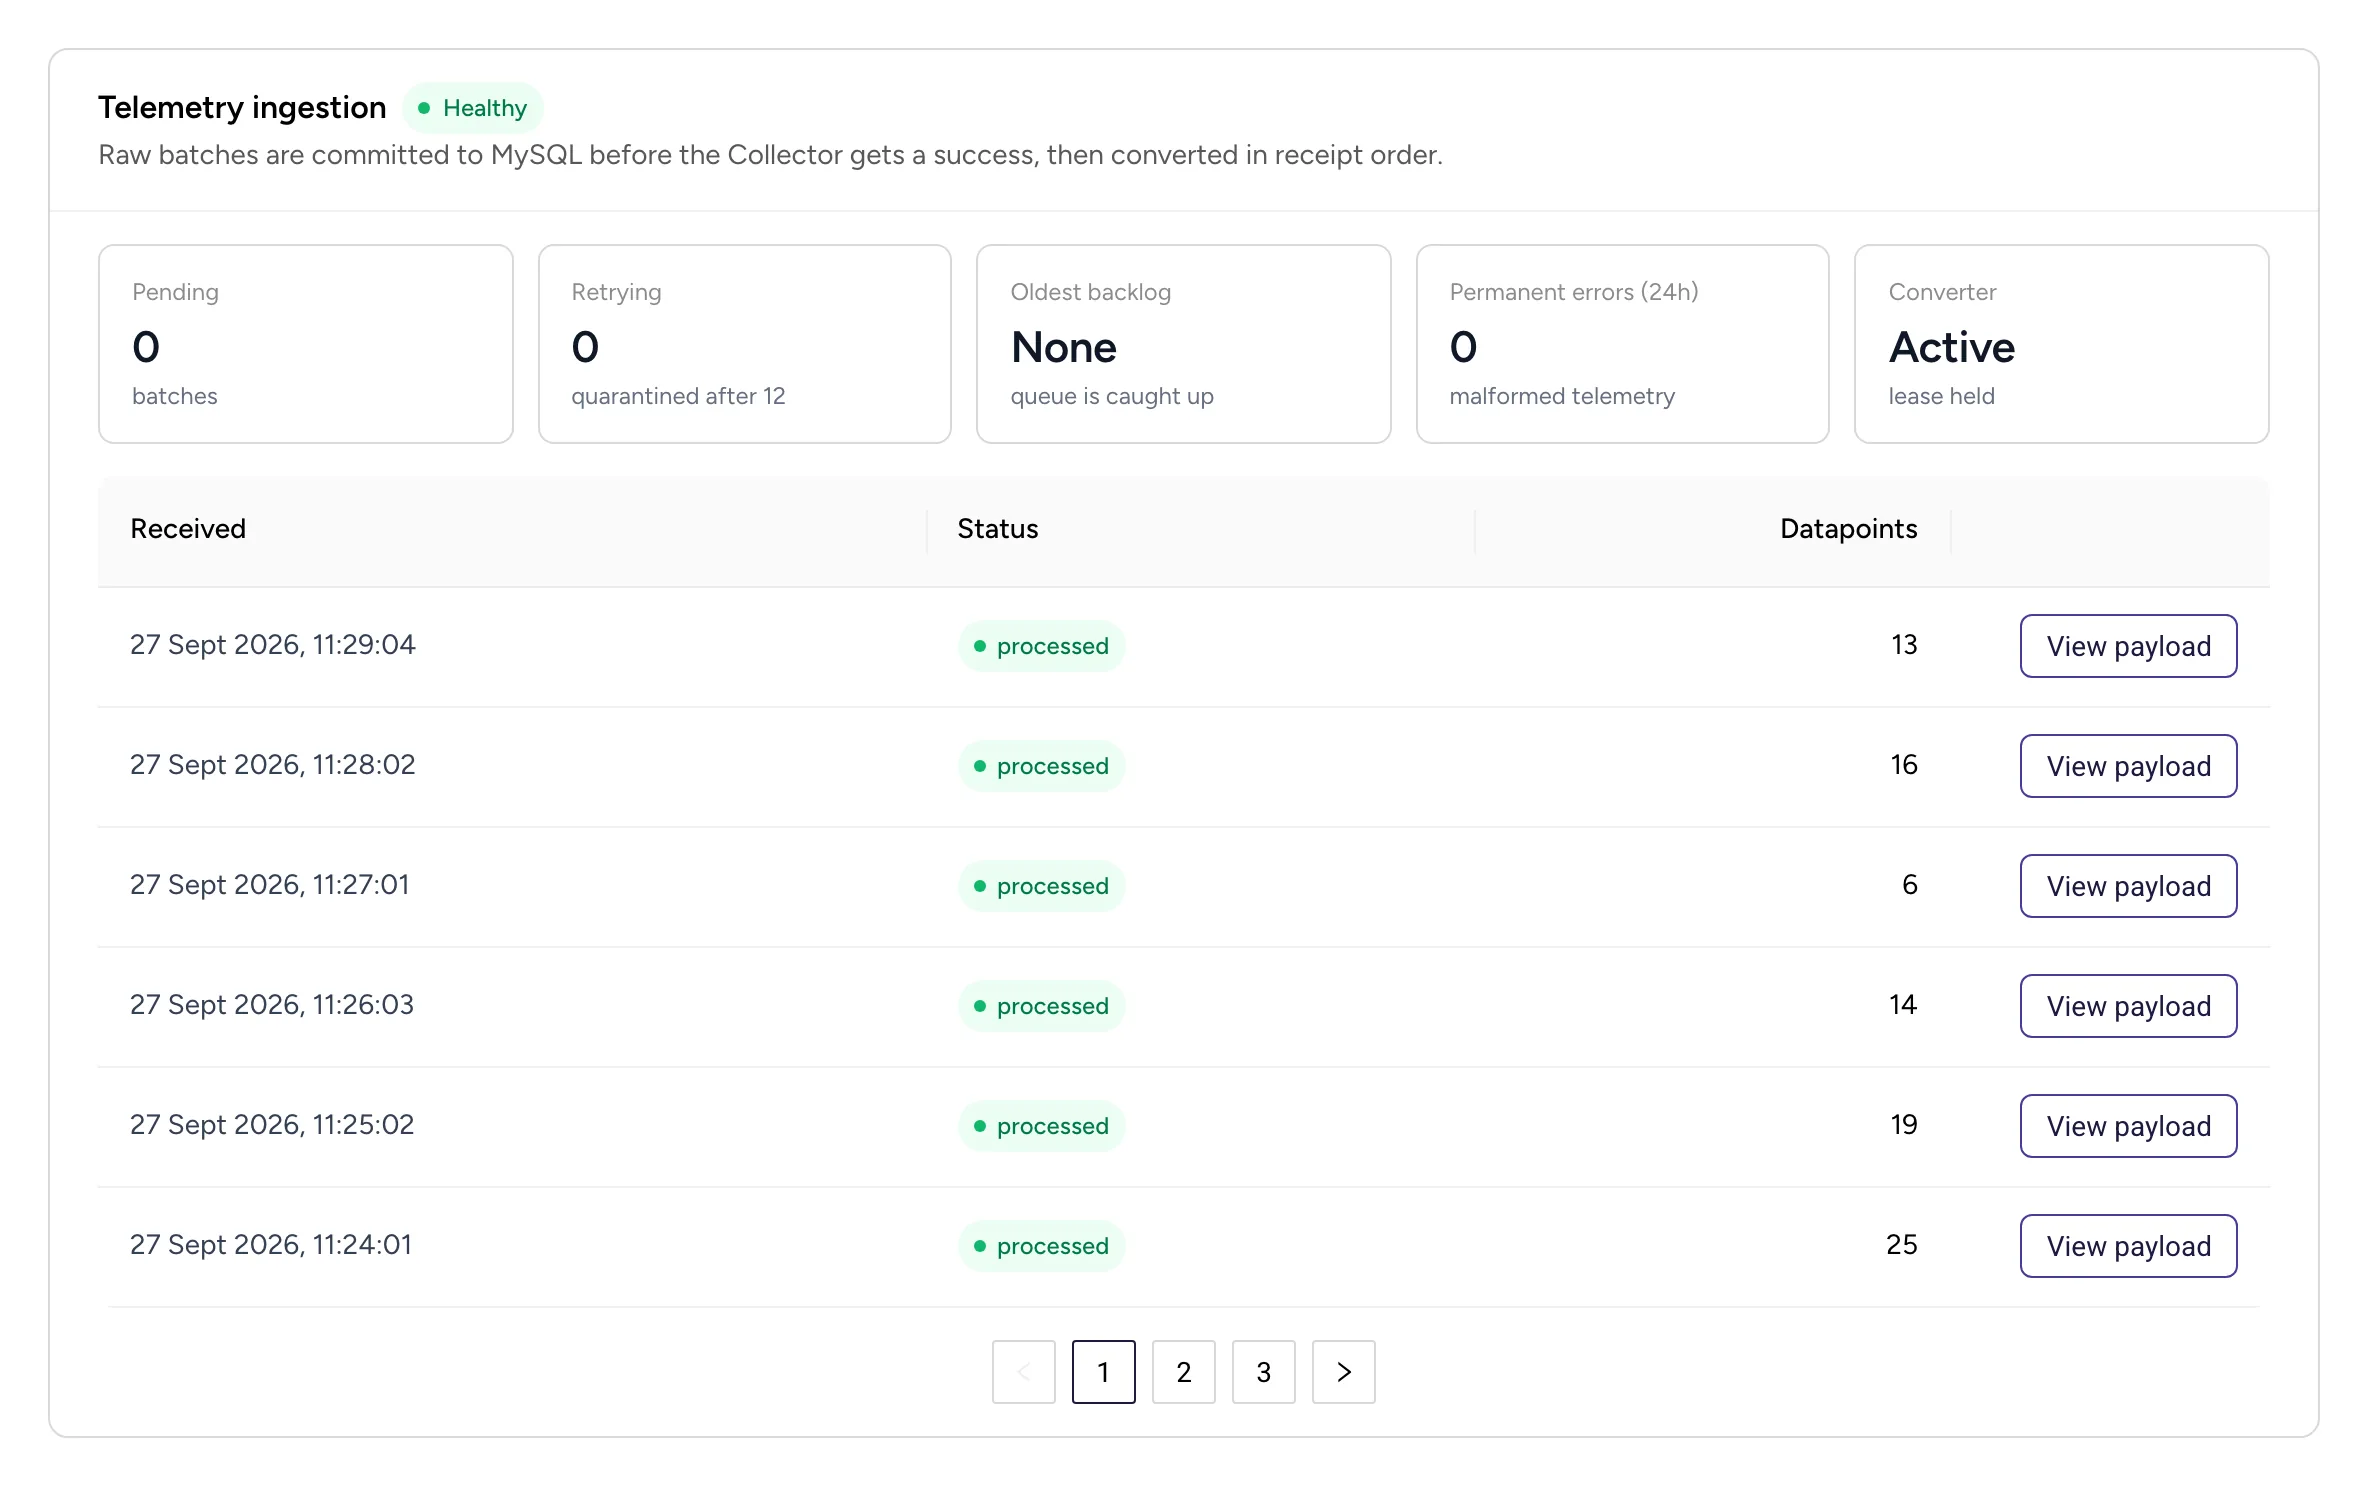
The Collector forwards authenticated batches over OTLP/HTTP to a DevLake ingest endpoint, with a persistent file_storage queue in front so batches survive Collector restarts and DevLake downtime. DevLake only returns success once the raw batch is committed to MySQL, so the queue is transport durability and MySQL is the record.
The queue is bounded at 512 MiB with fsync on, a single consumer and indefinite retry. It rejects new batches when full rather than blocking, because blocking hits a known persistent queue deadlock in the pinned Collector version. Queue fill and enqueue failures are exported as Collector metrics and scraped by Prometheus for alerting.
From raw batches to daily facts
A converter inside DevLake turns raw OTLP batches into hourly facts and then canonical daily rows that the rest of the product reads.
- Project attribution is a relation, not a label. One team's connection can belong to several DevLake projects, and stamping a project onto each metric would double count anything shared, so facts keep only the trusted team and project views join through a bridge table.
- Late data resolves against connection history, created and revoked times, rather than whichever connection currently has that team slug. If a slug is ever reused, queued data from the old team can't land on the new one. Anything ambiguous is held for review instead of guessed.
- Every replica polls, but only the holder of a database lease converts. The lease is a conditional update, so there's no separate coordinator.
- Batches convert strictly in receipt order because cumulative series state depends on it. A batch waiting on retry holds the queue rather than getting overtaken.
- Failures are classified. Retryable ones back off and get quarantined after 12 attempts. Malformed telemetry is marked permanent. A batch where one team had no matching connection still converts for everyone else and records who was skipped.
- Operators can replay whole UTC days from retained raw batches after fixing the cause. Raw batches are kept for 90 days, then deleted in bounded chunks.
- The claim query runs once per status instead of one
INlist, because MySQL can't use the composite(status, received_at)index to satisfy theORDER BYacross several values and would scan the whole processed history on every poll.
Keeping Prometheus
A forward connector feeds a second Collector pipeline for Prometheus. Claude Code exports delta sums, so that branch converts them to cumulative before exposing them for scraping. Live dashboards and the MySQL path share one authenticated ingest, and a failure in one branch doesn't take out the other.
A fix upstream
Placing telemetry credentials on projects exposed a gap in DevLake itself. Deleting a project through the core API gave plugins no chance to clean up state they owned for that project, so it could be left behind. I filed the issue upstream and fixed it: an optional project deletion hook for plugins, with plugin, blueprint and project cleanup running in one transaction so a plugin can veto the delete or roll it back. It was merged into Apache DevLake as apache/devlake#9091.
Dashboards and rollout
On top of the daily data I built the AI dashboards in Grafana: throughput, adoption and AI versus human code share, scoped to each person's project access.
Getting it to staging and production meant a fair amount of unglamorous debugging across Docker networking, routing and deployment convergence between the Collector, Prometheus, Grafana and DevLake. Tests use a real Claude Code delta export as the ingest fixture and Playwright covers minting credentials and the ingestion health panel. A small demo sender replays synthetic multi developer telemetry against a local stack, and scripted Claude Code sessions on a test repo checked the numbers end to end, from a real run all the way to the dashboards.
Related work
Both were built for the same DevLake based product. Telemetry credentials are managed by the same admins the auth work introduced.